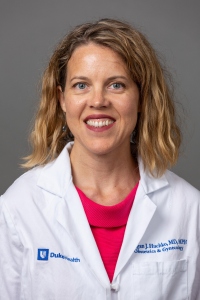
Faculty Perspectives: Megan Huchko
Megan Huchko, Associate Professor in the Department of Obstetrics & Gynecology and the Duke Global Health Institute
Bass Connections Project Team: Big Data for Reproductive Health
A practicing OB-GYN, who specializes in cervical cancer prevention and global women’s health, Megan Huchko has led Bass Connections project teams since 2017. For the past two years, she has co-led a team with Amy Finnegan (IntraHealth International) that aims to improve understanding of family planning initiation and discontinuation (“churn”) by providing stakeholders with curated data and data visualization tools to inform their advocacy and policymaking efforts.
Below are excerpts from Huchko’s remarks at a Spring 2020 Bass Connections orientation for team leaders.
Getting the Most Out of Good Data
The heart of our project has been trying to find ways to better understand, visualize and utilize data that comes from the United States Agency for International Development’s (USAID) Demographic and Health Survey (DHS), which is collected in about 80 countries around the world. The survey asks a lot of general demographic questions but there’s a component called the “Contraceptive Calendar” where they ask women questions about their contraceptive use every month for the five years preceding the time of their survey.
Our team has done some work validating the strength of the data, but one of the global limitations of the survey is that it’s quite hard to understand the data without pretty significant training and analytic skills. There is all this effort that is being put into funding the DHS and for the countries that are implementing the survey, but they aren’t really getting a lot back from the data.
Data Visualization and Stakeholder Engagement
The goal of the first year of our project was to create data visualization tools in which we could take one country’s data and look at contraceptive use and discontinuation patterns across different types of populations, such as postpartum women, women in partnerships, etc., and then compare these trends across time. Within the first year, we had a subgroup of our team that developed these data visualization techniques through a platform on R Shiny.
We had another subteam that was engaging with key stakeholders, both around the Triangle area and internationally, to see how they would use the program as we were developing it. We wanted to make sure we were developing our tools for programmers, researchers and people on the ground. As the programming team was working to develop their web-based tools, the stakeholder engagement group was meeting with people and agencies in the area and at conferences.
Sharing Findings
In the first year, we presented our data visualization tools at the International Conference for Family Planning in Kigali, Rwanda. We had another presentation at the Population Association of America, then at the Women Deliver Conference in Vancouver. At the end of the year, we published a paper on one of the tools we were using for data visualization. We also engaged with the DHS group at USAID and took a trip to D.C. to meet with them. They were very enthusiastic and are actually promoting this tool on their website.
How a Project Evolves Over Time
This year, we wanted students to be able to dig deep into the data and see if they could develop machine learning algorithms to predict patterns in women’s contraceptive use and discontinuation. Our stakeholder engagement group is doing some structured interviews and surveys with people. We’ll be administering the surveys in Kenya this summer to think about how a machine learning tool like this could help us individually predict a woman’s risk of contraceptive discontinuation.
We’ve also taken an unexpected detour to think about the ethical implications of our work. Our students are now thinking about how precision medicine impacts the way that we counsel women who may already be in a vulnerable state with regard to family planning and contraceptive use. I think it is good to have the students understand the potential drawbacks to what we’re doing, see how people have dealt with that in the past and figure out some steps we can take to maximize the benefits of a tool that we are introducing.
Looking to the Future
In 2020-2021, we are going to look at the use of social media data in describing contraceptive use, identify sources of available data and develop a new prediction model using this data. We will see if a tool using this data can help us do a better job of predicting contraceptive discontinuation as well as contraceptive use patterns. We would also like to think about how to utilize all of that data to be region, clinic or city-specific, and to do better counseling and service delivery.
Advice for New Team Leaders
Bass Connections has been a really nice way to make connections with students on a one-on-one basis and do more in-depth research with them individually, both throughout the time of the project team and also going forward.
As team leaders think about their projects, I would recommend they:
- Set meeting times ahead of the semester
- Hold a group meeting with potential new team members, to save everyone time and to give you a chance to look at everyone’s dynamic together
- Have old team members come and talk to new team members, because student to student recommendations are helpful
- Ask your team for feedback, then make corrections to the course at the beginning of a new semester
- Provide students with one-on-one structured feedback throughout and at the end of each semester
- Help students find the balance between taking initiative to set their own objectives and working together as a team to develop overall project objectives ahead of time.
See other faculty perspectives and learn how you can get involved in Bass Connections.

