Documenting Microbial Changes in Ocean Ecosystems
Project Team

Team profile by members of the Oceans of Microbiomes project team
Microbes are tiny organisms that are found everywhere and are core components of the ecology, biochemistry and geochemistry of all ecosystems. But it is only recently that scientists have appreciated the vast diversity of microbes in the global ocean. At the Duke Marine Lab, the Johnson and Hunt labs have been sampling weekly at the Piver’s Island Coastal Observatory (PICO) for over 10 years, measuring key variables of the marine ecosystem and documenting changes in this ecosystem.
The Oceans of Microbiomes project team examined time-series data of microbial communities from weekly sampling over three years at PICO from 2011-2013 and focused on marine cyanobacteria, an excellent model marine microbe that is a key primary producer, and SAR11, which constitutes up to one half of all microbial cells in the surface ocean. This project seeks to compare and contrast the diversity and ecology of these two dominant microbes of the coastal marine environment adjacent to the Duke Marine Lab. The aim of the project is to unravel potential mechanisms of microbiome structuring and change observed in the marine environment.
Our key research questions were:
- How does SAR11 and cyanobacteria community composition change over time? Do they differ in a significant way or behave in similar patterns?
- How and to what extent do environmental variables affect these two microbiome communities?
- Are closely-related strains more likely to exhibit similar ecologies?
In the fall semester, we focused our efforts on analyzing data on environmental variables and community structure. Using MATLAB and R, we built data visualizations that showcased the relative abundance of 97% identity Operational Taxonomic Units (OTUs) and more fine scale oligotypes for both cyanobacteria and SAR11. Here are some of our major findings:
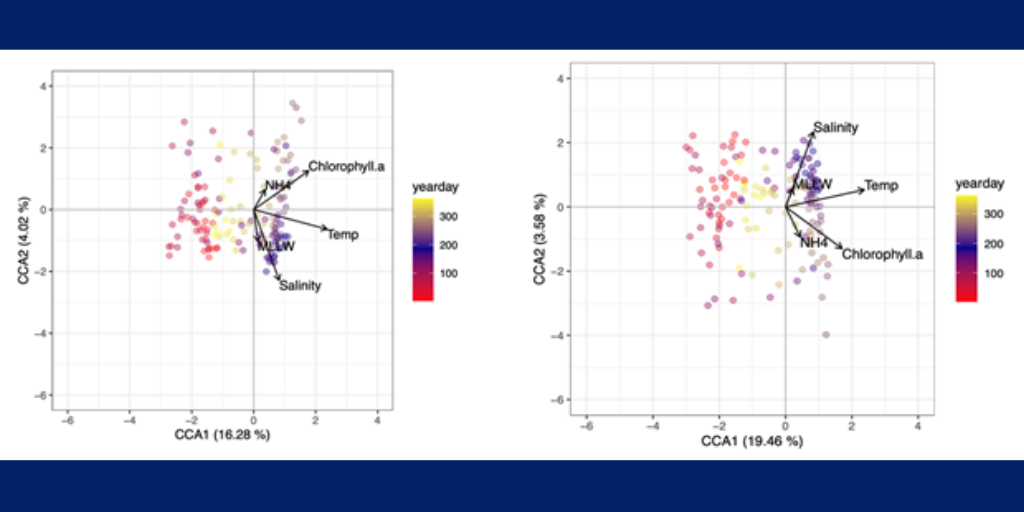
1. Temperature and salinity are the major environmental variables contributing to variance in the cyanobacteria microbial community for both OTUs and oligotypes (Figure 1; P<0.001).
2. Cyanobacteria oligotypes follow a stronger seasonal pattern from 2011-2013. Even though the community as a whole mostly peaks in the summer, some individual OTUs can peak at different times (Figure 2).
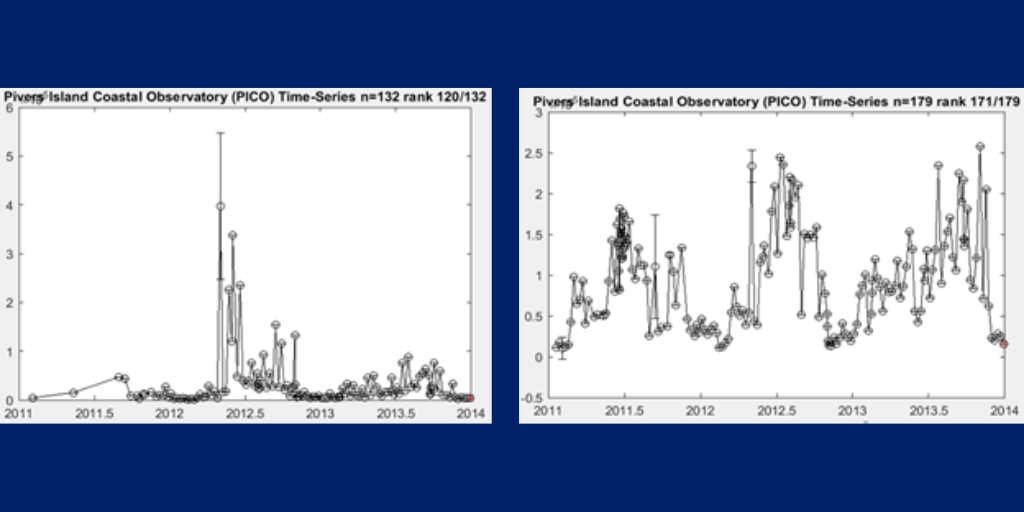
3. Temporal variability of picocyanobacteria in cells/ml based on flow cytometry at PICO, 2011-2013 (Panel A). The highest peak occurs in spring 2012 as an anomaly from the rest, where abundance is very low.

In the fall, our team navigated different ways of making this progress possible. We had one team member who worked in the lab and diligently continued the weekly PICO sampling, and all of us met through Zoom. The team divided up into one group studying cyanobacteria and the other investigating SAR11. Building visualizations using MATLAB and R, undergraduates shared their findings with the broader group. Graduate students mentored the undergraduates, sharing code and teaching how to convert data formats to craft visualizations. As the semester progressed, the cyanobacteria group and SAR11 group were able to better communicate with each other to tackle challenges and unify presentation formats into a coherent, “singular” voice. We were proud to make these accomplishments possible from a remote setting. In the spring semester, the team evolved to accommodate research priorities. Part of the team, consisting of a graduate student and an undergraduate student, worked in person in the lab culturing Synechococcus, the most abundant species of cyanobacteria, from seawater, with a number of different isolation techniques tested (Figure 3). The medium-grown Synechococcus will be analyzed to try to link genome content and environmental factors.
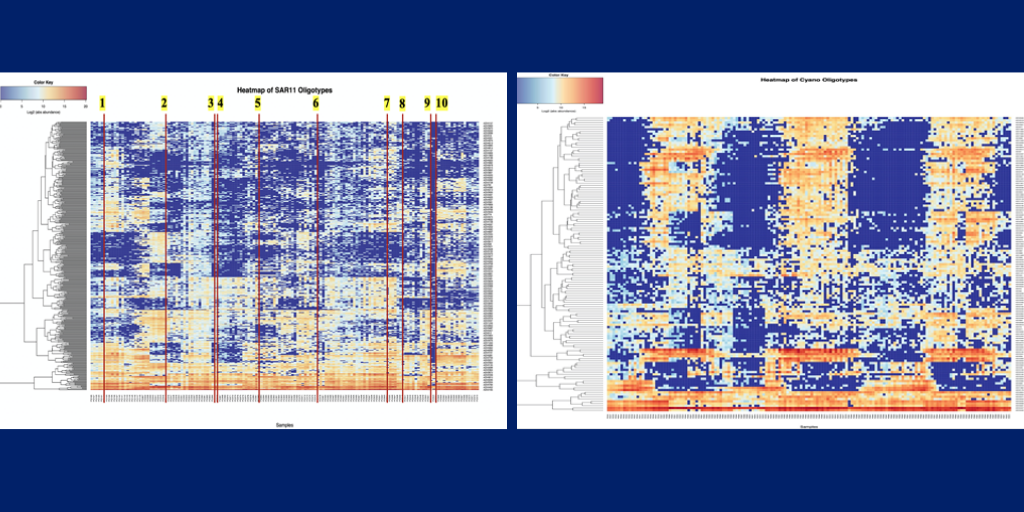
The second group, also a graduate and undergraduate student, remote collaboration and focused on further analysis on clades of SAR11 and cyanobacteria OTUs and oligotypes. This team visualized SAR11 and cyanobacteria community composition patterns over time using heatmaps. Moreover, by incorporating phylogenetic trees and other sequence-based analyses into the analysis, this team also tried to understand whether closely-related clades are more likely to exhibit similar patterns in the time series. The team has found that SAR11 oligotypes show abrupt changes in dominant types that can be mapped onto disturbance, which are represented by the labeled lines in Figure 4, but they show less seasonal trend compared to cyanobacteria oligotypes (Figure 5). Finally, the team examined the relationship between genetic distance and similarities in patterns using Mantel correlograms.
Diversity and Variability of Two Core Taxa of the Coastal Marine Microbiome
Poster by Maya Suzuki, Medy Mu, Taylor Smith, Cynthia Wang, Sara Blinebry, Jessica Gronniger, and Junyao Gu
