Team Shares Novel Tools to Explore Data on Contraceptive Use
April 4, 2019
By Celia Mizelle ’19 and Saumya Sao ’20
Our Bass Connections Big Data for Reproductive Health (BD4RH) team is working on novel ways to visualize contraceptive calendar data collected by the Demographic and Health Survey (DHS) Program. As part of the Duke Center for Global Reproductive Health, our interdisciplinary group of researchers has created online, user-friendly tools to promote accessibility of this important but underutilized data. We aim to facilitate its use by researchers, program implementers and advocates.
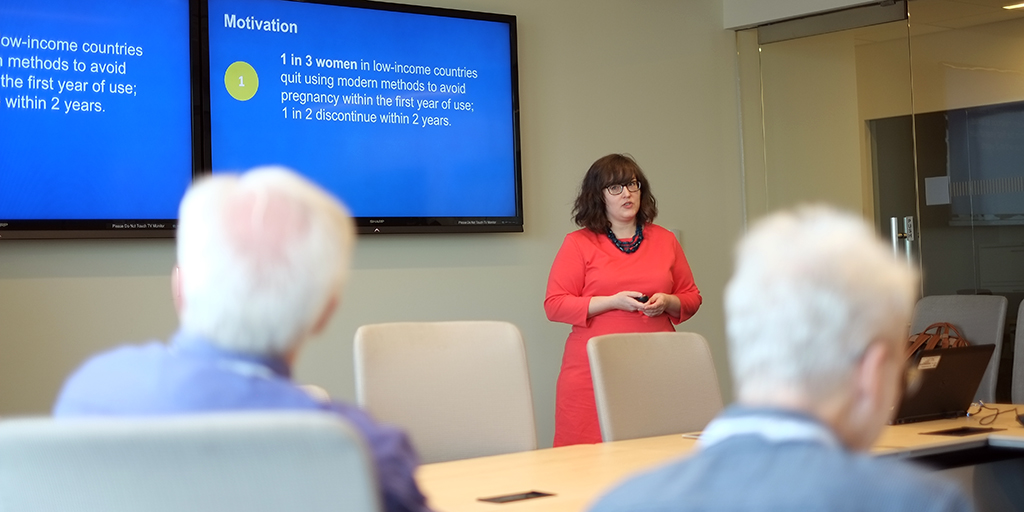
On March 22, we traveled with team leaders Dr. Amy Finnegan and Kelly Hunter and our fellow undergraduate team members Nicole Rapfogel, Molly Paley and Daisy Fang to the DHS Program office in Rockville, Maryland to meet with key stakeholders who collect and use the contraceptive calendar data.
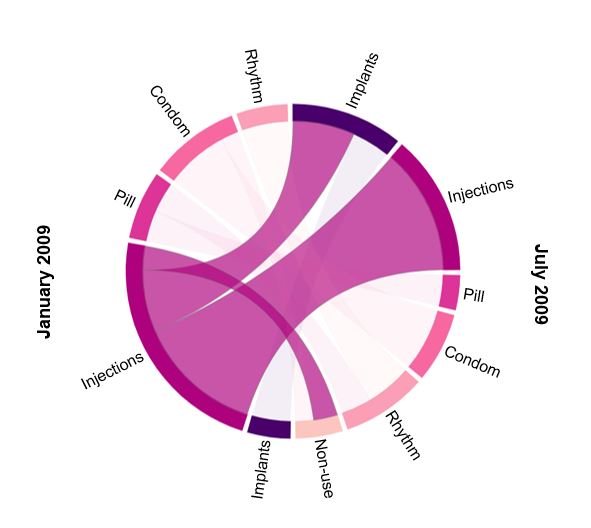
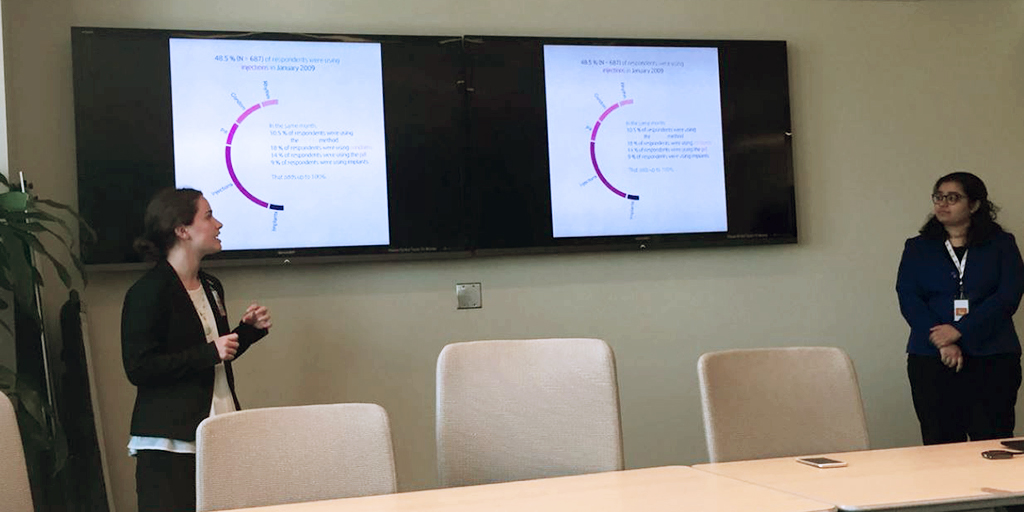
We shared novel approaches to visualizing the calendar data. Specifically, a chord diagram tool shows how contraceptive users flow from one method during a selected starting month to non-use (contraceptive discontinuation) or a different method (contraceptive switching). We also shared a tool that displays trends of contraceptive prevalence and discontinuation over time and allows users to view differences in rates based on a variety of sociodemographic and geographic variables.
Dr. Finnegan also discussed the use of big data analytics to provide fresh insights into the data and shared preliminary results from an unsupervised machine learning model her team has created to better understand contraceptive trajectories.
The team discussed potential opportunities for collaboration with DHS technical staff, the Track20 project and Avenir Health—groups working to facilitate use of the data to inform research and programmatic efforts worldwide. The meeting highlighted areas of potential future development for the BD4RH team, including ideas for new data visualization tools and connections to ground-level stakeholders and program managers who might use the data in their work.

In addition to our presentation at the DHS Program, members of our team gave a poster presentation at the 2018 International Conference on Family Planning in Kigali, Rwanda. We will also present at the Annual Meeting of the Population Association of America in Austin, and the Women Deliver 2019 Conference in Vancouver.
Join Us for a Local Stakeholder Meeting on April 19
If you are interested in learning more about the BD4RH team’s data visualization techniques as well as updates from the meeting about contraceptive calendar data accessibility, consider attending our local stakeholder meeting on Friday, April 19, from 8:30 to 9:30 a.m. in Trent Hall. Breakfast will be served. RSVP.
Learn More
- Read about this project team, Big Data for Reproductive Health.
- Come to the Bass Connections Showcase on April 17 to view this team’s poster and talk with team members.
- Explore the Bass Connections themes of Information, Society & Culture and Global Health.